

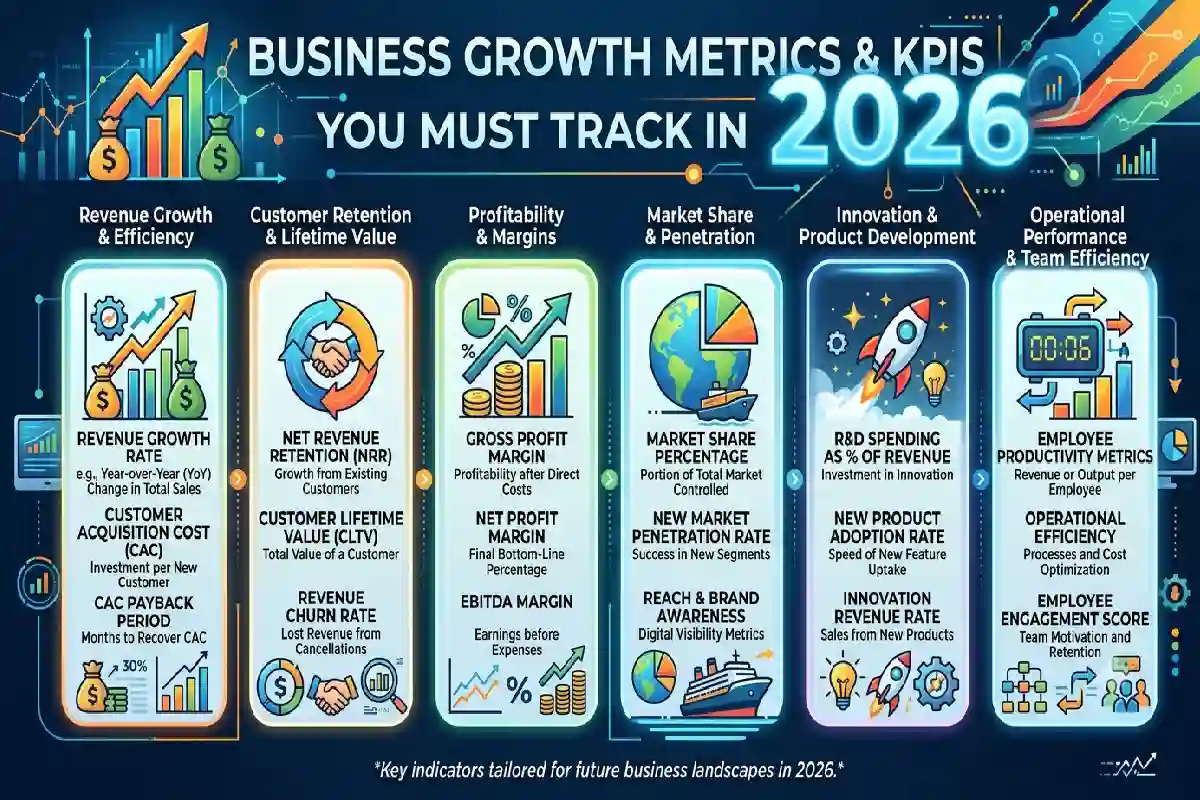
Business Growth Metrics & KPIs You Must Track in 2026
Last Updated: September 15, 2026
Metrics & KPIs. Important measures of business growth in 2026 will be revenue growth rate, customer lifetime value, MRR for subscription businesses, and NPS, as a leading indicator of retention and referrals.
These are the key metrics, receipt tracking, and 2026 benchmarks you can add to dashboards, SOPs, or client reports:
1. Revenue growth rate formula
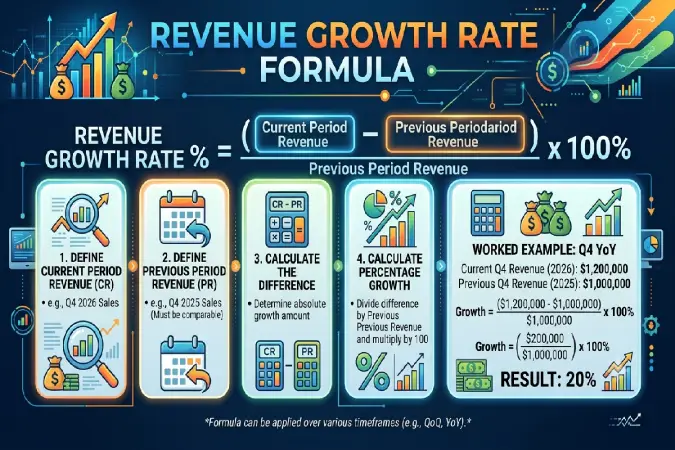
Revenue growth rate measures how much (or how little) your top line is increasing from period to period. For startups, scaleups, and established businesses alike, this is the primary KPI.
The same formula applies to a core, given by: where is the position of the core, is the boundary of the core, and is the radius of the core (Edwards et al., 2005).
RevenueGrowthRate
= CurrentPeriodRevenue – PriorPeriodRevenue / PriorPeriodRevenue
X 100%
You can apply this as:
Month-over-month (Mo M)
MoMGrowth = RevenueThisMonth – RevenueLastMonth / RevenueLastMonth
X 100%
Year-over-year (YoY)
YoYGrowth = (RevenueThisYear- RevenueLastYear / RevenueLastYear X 100%
Compound Monthly Growth Rate (CMGR) for a smoothed view over multiple months:
CMGR = ( EndingRevenue/BeginningRevenue) 1 / number of months – 1
Ways to measure it
Identify short-term spikes as they occur on MS by calculating MoM and YoY.
- Consider 12–18months of history before overreacting to one-off events.
- Segment (by product line/channel/region) to see where your growth is coming from.
2. Customer lifetime value (LTV) calculation
LTV – what is it? It is the sum of all the profit you expect to make throughout the lifetime of an average customer. It is important for your CAC goals, pricing, and retention budgets.
Simple LTV formula (all businesses)
LTV = AverageOrderValue X PurchaseFrequency
X is returned from a function.
Or, using ARPU (average revenue per user):
LTV = ARPU X Average Customer Lifespan
Subscription / SaaS LTV (investor-grade)
For recurring revenue models, use gross margin and revenue churn:
LTV = ARPU X GrossMargin% / RevenueChurnRate
Where:
- ARPU =average ofrevenueper user/accountper period(match the churn period).
- Gross Margin %= (Revenue- COGS) / Revenue.
- Revenue Churn Rate = (net MRR lost from existing customers) / (starting MRR).
LTV in practice and how to use it
- Benchmark LTV: CAC ratio; 3:1 or higher is commonly cited for healthy unit economics.
- Employ LTV to define upper limits of acceptable CAC as well as payback period targets.
- Track LTV by cohort (signup month, channel, product) to see which customers are most profitable.
3. Monthly recurring revenue (MRR) tracking
MRR is the core metric for any subscription business (Software as a Service, membership, recurring services). It clearly defines the recurring revenue for the business and serves as the foundation for planning growth.
Definitions to highlight
- MRR=the sum of Monthly Recurring Revenue from all the paid subscriptions.
- ARR = MRR x 12 (the annualised recurring revenue).
Break MRR into components for clarity:
- Revised MRR: from existing customers.
- Expansion MRR: upsell, add-ons, cross-sells.
- Contraction MRR:
- Churned MRR: accounts lost.
- Net New MRR = New + Expansion Contraction Churn.
Growth rate of MRR
MRRGrowthRate = MRRThisMonth – MRRLastMonth / MRRLastMonth x 100%
Track MRR in a way that works for you:
- You reconcile MRR with your billing system (Stripe, Chargebee, etc.) monthly.
- Split MRR by plan, segment, and channel so you can see what is actually growing.
- Monitor Net Revenue Retention (NRR) alongside MRR:
NRR = StartingMRR + Expansion – Churn – Contraction / StartingMRR X 100 %
4. Net Promoter Score (NPS): formula & 2026 benchmarks
NPS determines how loyal and likely your customers are to refer your brand. It is also one of the most accurate leading indicators of retention, referral and future growth.
NPS formula
Ask: Would you be willing to recommend [company/product] to a friend or colleague? (0–10) (with 0 being extremely unlikely and 10 being extremely likely).
- Promoters: 9–10.
- Neutrals: 7-8
- Detractors: 0–6
NPS=%Promoters%Detractors
What is a “good” NPS in 2026?
Although benchmarks are published for each industry, 2026 from Bain, Qualtrics XM Institute, Retently etc., provide typical ranges for:
- B2B SaaS: the usual conversion rate is about 30–45, although high-best-in-class SaaS require to be above 50 or 60.
- Ecommerce/retail: typically 20–40; best-in-class brands push 50+.
- Financial services/fintech: often 30–50, some leading firms above 60.
- Hospitality (hotels, restaurants): can vary from 30–60+ and depends on segment and region.
General interpretation:
- < 0: the few more detractors than promoters; urgent retention problem.
- 0–30: fine, but could have been more enthusiastic.
- 30–50: good, well above many industry averages.
- 50+: strong; tends to be significant in terms of growth and retention.
Combine NPS with churn, NRR and repeat purchase rate and find out if loyalty is leading to revenue.
5. Growth rate benchmarks by industry (2025–2026)
Benchmarks vary a lot depending on your business model and stage. The most comprehensive 2026 data I found is for B2B SaaS; ecommerce and retail readers will notice much higher high-level figures.
B2B SaaS – ARR growth by stage in 2026
The median YoY ARR increase has slowed down since the “growth at all cost” period, while efficiency is now in focus.
| ARR Stage | Median YoY Growth (2026) | Top Quartile YoY Growth |
| < $1M | ~74–100% | ~138–150%+ |
| $1M–$5M | ~45–80% | ~100–115% |
| $5M–$20M | ~27–35% | ~50–95% |
| $20M–$50M | ~24–25% | ~50–60% |
| > $50M | ~15–20% | ~30–40% |
Interpretation bands (useful for internal targets):
- Hypergrowth: 75%+
- Very strong: 40–75%
- Healthy: 20–40%
- Moderate 10 20%:
- Very Low: 0–10%
For private SaaS overall, the recent 2026 surveys indicate median revenue growth in the neighborhood of 25–26% YoY, with those companies that are the best performers according to that metric well north of those levels.
Ecommerce & Retail: Time it takes for revenue to increase
Global ecommerce growth is still solid but more moderate than the pandemic boom:
- The following are the global ecommerce sales projections by 2026, which stand to be at approximately $6.88 T, signifying 7.2% RoY growth from 2025.
- S. retail e-commerce saw about 5.4% YoY growth in 2025, and momentum continued into early 2026.
For individual ecommerce brands, healthy YoY revenue growth often looks like:
Precise “good” growth is very specific to niche, CAC environment, and profitability requirements; so take them as suggestions, not as absolutes.
Combining it all: a bare-bones 2026 growth dashboard
For most businesses, a focused dashboard might include:
- Growth of revenue (Mo M & Yo Y)
- MRR / ARR and MRR growth rate (for subscription)
- LTV and LTV: CAC ratio
- NRR (for SaaS) or repeat purchase rate (for ecommerce)
- NPS with trend over time and by segment
- Growth benchmark relevant to the industry (e.g., SaaS ARR growth by stage, or growth for ecommerce categories)
If you can tell us your business model (SaaS, ecommerce, service) and rough revenue stage, I’ll adapt these formulas and metrics to build a specific KPI structure with target ranges and sample calculations.
Conclusion
In 2026, Sustainable Business Growth is about noticing a handful of high-signal metrics revenue growth rate, LTV, MRR (as a subscription business), and NPS and using those to make disciplined decisions on acquisition, pricing, and retention.
Focus on:
Deriving regular (MoM and YoY) revenue growth to differentiate between temporary fluctuations and real trends.
Helping to determine rational CAC goals by utilizing LTV (with SaaS‘s gross margin and churn) to inform.
How do you keep control over MRR as a system (new, expansion, contraction, churn) and watch the NRR to see if your existing customers are propelling it?
Benchmarking NPS to your industry, rather than chasing an abstract “perfect score” and then connecting your score improvements to retention and referral results.