

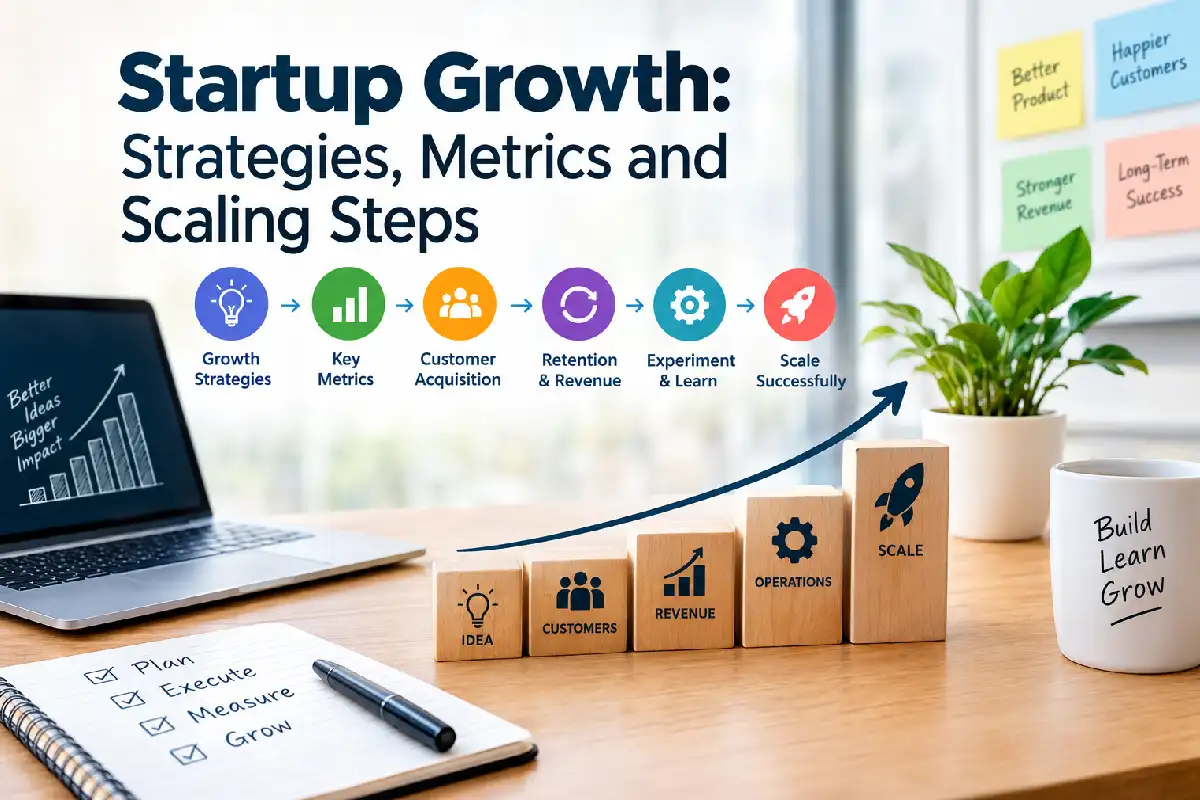
Startup Growth: Strategies, Metrics and Scaling Steps
Last Updated: September 22, 2026
Startup growth is actually much more than sales, web visitors, or member count. Sustainable growth is creating a business approach, able to pull in the ideal market, offer it an abundance of value, earn revenue with good margins, and be scalable without proportionally growing the costs.
At an early-stage startup, your focus maybe on finding product-market fit and demonstrating that customers return time and time again. As the business matures, your focus could then shift to repeatable channels for acquisition, retention, unit economics, operational efficiency and a scalable distribution.
Hence the metrics and measures that matter will evolve from validation to growth, and then to scale. Similarly, the current startup-growth literature highlights the fact that companies should tailor to their KPI and operating focus in line with their stage of lifecycle and not necessarily suit the same startup growth playbook.
The guide On startup growth 02 why growth matters if you want to build a fast growing startup, you need to understand and measure your growth, know where to focus in order to grow, understand when and how to test different levers to acquire and retain users and When you are in a good place to grow.
What Startup Growth Means at Each Stage
Not all startups grow in the same way. A pre-seed software startup, a growing e-commerce company, and a Series B SaaS business may all have completely different definitions of healthy growth.
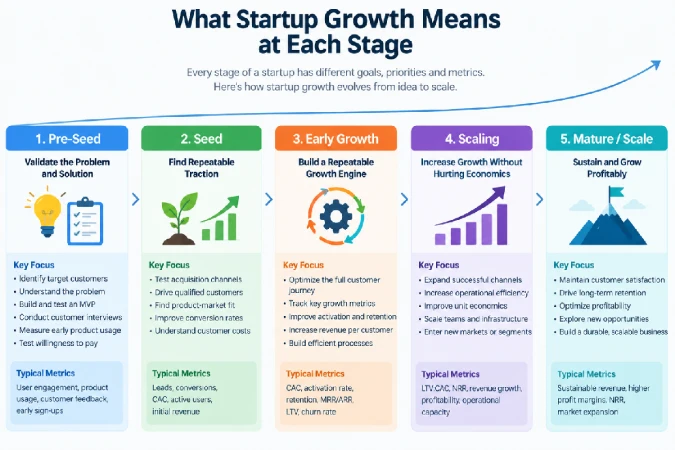
A useful approach is to divide startup growth into several stages:
1. Pre-Seed: Validate the Problem and Solution
At the pre-seed stage, the primary objective is usually not rapid customer acquisition. It is learning whether a meaningful customer problem exists and whether the proposed solution addresses it.
Key priorities include:
- Identifying a specific target customer
- Understanding the problem customers want solved
- Building and testing a minimum viable product
- Conducting customer interviews
- Measuring early product usage
- Testing willingness to pay
- Identifying the first signs of product-market fit
At this point, metrics such as total website traffic or social-media followers can be misleading. A smaller number of users who repeatedly use a product can provide more useful evidence than thousands of visitors who never return.
2. Seed Stage: Find Repeatable Traction
Once the startup has evidence that customers receive value, the focus begins shifting toward repeatable growth.
The company may test:
- Content marketing
- Search engine optimization
- Outbound sales
- Partnerships
- Communities
- Referrals
- Paid advertising
- Product-led acquisition
The goal is to discover one or more channels that can consistently generate qualified customers.
Instead of asking, “How many people visited our website?” founders should ask questions such as:
- How many visitors became leads?
- How many leads became customers?
- Which acquisition channel generated those customers?
- What did each customer cost?
- How many customers remained active?
- How much revenue did each customer generate?
3. Early Growth: Build a Repeatable Growth Engine
At this stage, the startup has evidence that customers want the product and that at least one acquisition mechanism works.
Growth becomes more systematic.
Teams begin tracking metrics such as:
- Customer acquisition cost (CAC)
- Activation rate
- Conversion rate
- Retention
- Churn
- Monthly recurring revenue (MRR)
- Annual recurring revenue (ARR)
- Customer lifetime value (LTV)
- CAC payback period
The objective is to improve the entire customer journey rather than simply increase traffic.
The AARRR framework—acquisition, activation, retention, revenue, and referral—is one established way to organize these growth stages and associated metrics.
4. Scaling Stage: Increase Growth Without Destroying Economics
Scaling is different from simply growing.
A startup can increase revenue while simultaneously increasing costs, headcount, support requirements, and infrastructure expenses. Scaling requires the company to increase output more efficiently.
If, for instance, a software company doubles sales, but at the same time doubles costs of operating. It has grown, but he economics have not necessarily improved.
A scalable model refers to generating revenue at a faster rate than the cost to serve.
Anybody like to mention the cost associated with this approach?
This gap is now becoming more pronounced when startups start to ramp up their marketing spend, increase headcount, move into new geographies or scale sales capacity.
How to Set Measurable Growth Goals
A growth strategy becomes difficult to manage when goals are vague.
“Grow the business” is an objective, not a measurable target.

A stronger goal might be:
To increase the total number of qualified monthly leads from 2,000 to 3,000 within 6 months and keep the lead to customer conversion rate to a minimum of 8%.
This provides the team with an expected result, time, and quality constraint.
Use SMART Growth Goals
Startup growth goals can be structured using the SMART framework:
- Specific: Define exactly what should improve.
- Measurable: Attach a number to the outcome.
- Achievable: Base the target on available resources and historical performance.
- Relevant: Connect the goal to an important business outcome.
- Time-bound: Establish a deadline.
For example:
Weak goal:
Increase customer acquisition.
Better goal:
Generate 500 new qualified customers during the next quarter while keeping blended CAC below $100.
Choose a North Star Metric
A North Star Metric is a central measure intended to represent the value customers receive from the product and help align teams around growth.
The appropriate metric depends on the business model.
Examples could include:
- A marketplace: completed transactions
- A SaaS product: active accounts receiving core value
- A subscription service: retained paying subscribers
- A productivity product: completed workflows
- A media platform: engaged users consuming content
The important point is that the metric should connect user value with sustainable business performance.
Y Combinator’s discussion of scaling growth similarly emphasizes the importance of having a clearly understood number that the growth team is actively trying to improve.
Build a Growth KPI Dashboard
A practical startup growth dashboard might include:
| Growth Area | Example Metric |
| Acquisition | Qualified leads |
| Activation | Activation rate |
| Retention | D30 retention |
| Revenue | MRR or ARR |
| Monetization | Conversion to paid |
| Efficiency | CAC |
| Customer economics | LTV |
| Sales efficiency | CAC payback |
| Expansion | Net revenue retention |
| Referral | Referral rate |
Don‘t put too many metrics on the main dashboards. Each metric should contribute to answering a business question or causing a decision to be made.
Understand Leading and Lagging Indicators
Revenue is an important lagging indicator. By the time revenue changes, the underlying customer behavior may have changed weeks or months earlier.
Leading indicators can provide earlier signals.
For example:
Leading indicators
- Signup volume
- Activation
- Product engagement
- Trial-to-paid conversion
- Qualified pipeline
- Repeat purchases
Lagging indicators
- Revenue
- Profit
- ARR
- Customer lifetime value
Tracking both helps founders understand not only what happened but also what may be driving future performance.
Acquisition, Retention and Revenue Growth Levers
Sustainable startup growth usually comes from improving several connected parts of the customer lifecycle.
A very high acquisition that results in the company losing most of those customers might be the symptom of an acquisition problem hidden under the diagnosis of retention problem. Conversely, a company that has very good retention but very few customer acquisition may not have enough customers to grow.
Acquisition Growth
Acquisition is about consistently reaching potential customers and turning them into users or leads.
Common acquisition channels include:
- SEO
- Content marketing
- Paid search
- Social advertising
- Email marketing
- Outbound sales
- Partnerships
- Affiliate marketing
- Communities
- Events
- Referrals
- Product-led growth
The correct channel depends heavily on the startup’s target market.
A B2B enterprise company may depend on sales development and partnerships, while a consumer application may rely more heavily on product referrals, paid acquisition, content, or app-store discovery.
Measure CAC by Channel
Customer acquisition cost can be calculated as:
CAC = Total acquisition and sales costs ÷ Number of new customers acquired
For example, if a startup spends $20,000 on a marketing campaign and acquires 200 customers:
CAC = $20,000 ÷ 200 = $100
However, blended CAC can hide important differences between channels.
A better dashboard may show:
| Channel | Spend | Customers | CAC |
| SEO | $5,000 | 100 | $50 |
| Paid Search | $10,000 | 100 | $100 |
| Outbound | $15,000 | 75 | $200 |
The startup should then investigate the quality and lifetime value of customers from each channel rather than automatically choosing the channel with the lowest initial CAC.
Improve Activation
Acquisition does not create sustainable growth if new customers fail to experience the product’s value.
Activation measures whether new users complete an important action that indicates they have reached an initial value milestone.
Examples include:
- Creating a project
- Completing a setup
- Inviting a teammate
- Making a first purchase
- Uploading a file
- Completing a first transaction
Even if a startup has ten thousand signups/month; perhaps two thousand of those signups actually perform their activation event.
This way, enhancing onboarding might be a better way to value-adding than simply purchasing more traffic.
Improve Retention
Customer retention is the extent to which Customers stay purchasing/using a product.
Common retention measurements include:
- Day 1 retention
- Day 7 retention
- Day 30 retention
- Monthly retention
- Annual retention
- Customer retention rate
- Revenue retention
- Churn rate
Useful for.
Instead of asking:
Number of customers?
Ask:
Where “month” refers to January, % of customers who signed up in January still exist after 30, 60 or 90 days?
A tool for confirming whether variations in acquisition, onboarding, price or product quality are impacting the customers.
Reduce Churn
Churn is one of the most significant constraints on startup growth in subscription business.
Potential causes include:
- Poor onboarding
- Weak product value
- Pricing problems
- Missing features
- Poor customer support
- Competitor switching
- Lack of product usage
- Changes in customer circumstances
Reducing churn can have a compounding effect because the company retains more of the customers it has already paid to acquire.
Expand Existing Revenue
Revenue growth does not have to come entirely from new customers.
Existing customers may provide additional revenue through:
- Upgrades
- Add-ons
- Additional seats
- Usage-based pricing
- Cross-selling
- Premium features
- Higher-value plans
For SaaS businesses, net revenue retention (NRR) can help measure how revenue from an existing customer cohort changes over time after expansion and contraction.
A company with strong expansion revenue may grow its existing customer base even before adding new accounts.
Improve Pricing and Monetization
Pricing is another major growth lever.
Possible experiments include:
- Changing plan structure
- Introducing a premium tier
- Offering annual billing
- Adding usage-based pricing
- Adjusting packaging
- Creating add-ons
- Changing free-trial length
- Introducing a freemium model
Pricing experiments should be evaluated beyond immediate conversion.
A lower price might increase signups while reducing revenue per customer. Conversely, a higher price might reduce conversion but increase revenue and improve customer quality.
The relevant question is therefore:
What pricing structure creates sustainable customer and revenue growth?
How to Run and Measure Growth Experiments
Growth experimentation turns assumptions into measurable tests.
Instead of saying:
“Customers probably need a simpler onboarding process.”
A growth team can formulate:
“If we reduce onboarding from seven steps to four, activation rate will increase because customers will reach the core product value faster.”
That statement can be tested.
Amplitude recommends structuring experimentation around a defined growth lever, a clear hypothesis, and measurable outcomes rather than treating experimentation as isolated tests.
Step 1: Identify the Growth Problem
Start with data and customer research.
For example:
- Website traffic is increasing.
- Signup conversion is stable.
- Activation is declining.
- Retention is weak.
The evidence suggests that acquiring more traffic may not solve the core problem.
The growth team should investigate activation and onboarding.
Step 2: Write a Hypothesis
A useful template is:
If we [make a change], then [primary metric] will improve because [customer reason].
Example:
If we add a guided setup checklist, activation rate will increase because new customers will understand the first steps required to experience product value.
Step 3: Select a Primary Metric
Every experiment should have a primary success metric.
Possible metrics include:
- Signup conversion
- Activation rate
- Trial-to-paid conversion
- Retention
- Revenue per visitor
- Average order value
- Churn
- Expansion revenue
You can also define guardrail metrics.
For example:
Primary metric: Trial-to-paid conversion
Guardrails:
- Refund rate
- Customer support complaints
- 30-day retention
This ensures that the team cannot claim an experiment was a success merely because of a short-term improvement that ultimately harms the overall user experience.
Step 4: Prioritize Experiments
Begin with issues that hold substantial potential business repercussions.
A simple prioritization model can consider:
Impact × Confidence × Ease
An experiment that has the potential to significantly diminish the bottleneck, is strongly hypothesized, and available reasonably soon may warrant priority.
But this score is a decision support, not as the ultimate truth. We must not forget that the assumptions behind this score must be challenged.
Step 5: Run the Test Properly
Depending on the product and experiment, teams may use:
- A/B tests
- Holdout groups
- Before-and-after comparisons
- Pricing tests
- Landing-page tests
- User interviews
- Qualitative usability tests
A/B testing makes sense if there is enough traffic for the different groups to be compared through randomisation.
The tests should have a predetermined success criterion.
Do not continually test the system and termination of the experiment just because a few of the earlier results seem favorable;
Step 6: Analyze the Result
An experiment can produce several outcomes:
- The hypothesis is supported.
- The hypothesis is not supported.
- The result is inconclusive.
- The experiment creates an unexpected effect.
No failure in experiment is entirely wasted.
Should the test prove invalid for a key assumption, the firm has learned something which will inform future choices.
Step 7: Document the Learning
Record:
- Problem
- Hypothesis
- Experiment
- Audience
- Primary metric
- Guardrail metrics
- Test duration
- Result
- Interpretation
- Decision
- Next experiment
Over time, this creates an institutional knowledge base.
The objective is not simply to run more experiments. It is to increase the quality and speed of organizational learning.
When Your Startup Is Ready to Scale
Scaling too soon is too costly.
It may have a product that is working for a small customer base, but not have the retention or acquisition economics, infrastructure, or operational structure in place to grow at a quick pace.
Before scaling aggressively, examine five areas.
1. Customers Consistently Receive Value
There should be evidence that customers are using the product and receiving meaningful value.
Look at:
- Retention cohorts
- Repeat purchases
- Product engagement
- Customer feedback
- Expansion behavior
- Referral activity
High acquisition numbers alone are not enough.
2. You Have a Repeatable Acquisition Channel
A startup should understand where customers come from and how that channel behaves economically.
For each major channel, measure:
- CAC
- Conversion rate
- Customer quality
- Retention
- LTV
- Payback period
- Capacity or saturation
A channel that works with $5,000 of monthly spending may behave differently at $500,000.
Scaling therefore requires testing whether the acquisition mechanism remains economically viable as spending increases.
3. Unit Economics Make Sense
Unit economics help determine whether acquiring additional customers creates or destroys value.
One commonly used comparison is:
LTV = Customer Lifetime Value ÷ Customer Acquisition Cost
For example, if estimated LTV is $3,000 and CAC is $1,000:
LTV = 3:1
But the ratio should not be considered in isolation.
The assumptions behind LTV matter, and the time required to recover acquisition costs matters as well.
4. Operations Can Handle Demand
Growth can expose operational weaknesses.
Before scaling, consider whether you have sufficient:
- Infrastructure
- Customer support
- Sales capacity
- Onboarding
- Billing systems
- Security controls
- Analytics
- Hiring processes
- Supply chain capacity
- Quality assurance
A successful campaign that generates ten times the normal customer volume can become a problem if the business cannot serve those customers effectively.
5. The Economics Survive at Larger Scale
A startup should test whether its growth model can expand without costs rising disproportionately.
For example:
Before scaling
- 1,000 customers
- $100,000 revenue
- $30,000 acquisition cost
After expansion
- 10,000 customers
- $1,000,000 revenue
- $300,000 acquisition cost
If the broader economics remain healthy, the model may have scalable characteristics.
However if, for instance, acquiring customers becomes prohibitively expensive or service costs escalate too quickly, the business may have to better its model before moving forward with growth.
Parallel to the recent startup scaling analyses, it also emphasizes the need for revenues to be able to grow faster than the cost of serving customers prior to significant operational add weight.
Common Startup Growth Mistakes
Even startups with strong products can slow their growth by focusing on the wrong problems.
Chasing Vanity Metrics
Traffic to the site, followers on social, number of downloads and registrations may be serve as a good diagnostic measures, but these do not necessarily mean business growth.
A new business must make sure activity metrics are associated with results like activation, retention, revenue, and customer worth.
Scaling Paid Acquisition Too Early
Increasing advertising spend can amplify both a good and a bad funnel.
If customers do not retain, increasing acquisition may simply increase the number of customers who eventually churn.
Ignoring Retention
Retention is often considered as belonging to the product team instead of growth.
In practice, retention impacts the economics of acquisition, lifetime value, referrals and recurring revenues.
Tracking Too Many KPIs
A dashboard with 100 metrics can be very busy but can hinder decision-making.
A better approach is to establish a small group of core KPIs and use supporting metrics to diagnose changes.
Copying Another Startup’s Playbook
A strategy that works for a large consumer platform may not work for a small B2B startup.
Growth strategy depends on:
- Business model
- Customer type
- Market size
- Product complexity
- Purchase cycle
- Price
- Competition
- Distribution model
- Available capital
Startup growth should therefore be built around the company’s own customer behavior and economics.
Startup Growth Metrics Cheat Sheet
The following metrics provide a practical starting point for a startup growth dashboard:
| Metric | Formula / Measurement | Why It Matters |
| Growth rate | (Current – Previous) ÷ Previous × 100 | Measures change over time |
| CAC | Acquisition spend ÷ New customers | Measures acquisition efficiency |
| Activation rate | Activated users ÷ New users | Measures initial product value |
| Conversion rate | Conversions ÷ Visitors or leads | Measures funnel efficiency |
| Churn rate | Lost customers ÷ Starting customers | Measures customer loss |
| Retention rate | Retained customers ÷ Starting customers | Measures customer persistence |
| LTV | Estimated customer value over lifetime | Estimates long-term economics |
| LTV | LTV ÷ CAC | Compares value with acquisition cost |
| CAC payback | CAC ÷ Periodic gross profit per customer | Estimates recovery time |
| MRR | Recurring monthly revenue | Tracks subscription revenue |
| ARR | MRR × 12 | Tracks annualized recurring revenue |
| NRR | Beginning revenue plus expansion minus contraction/churn | Measures existing-customer revenue movement |
| Referral rate | Referred customers ÷ Total new customers | Measures word-of-mouth contribution |
The specific metrics and data points should be customized for startup‘s business model and phase. Existing advice on startup metrics put a lot of weight on the fact that the most relevant key performance indicators will vary with startups’ phase of development, e.g., from pre-product-market-fit validation to scaling.
A Practical Startup Growth Framework
A simple growth operating cycle can look like this:
- Understand → 2. Measure → 3. Prioritize → 4. Experiment → 5. Analyze → 6. Scale → 7. Repeat
Understand
Identify the customer problem, target audience, and biggest constraint in the growth funnel.
Measure
Establish baseline metrics and cohorts.
Prioritize
Choose the bottleneck with meaningful potential business impact.
Experiment
Develop a hypothesis and test a specific intervention.
Analyze
Evaluate the primary metric and guardrails.
Scale
If the result is reliable and economically attractive, expand the successful approach.
Repeat
Growth is not a one-time project. Markets, customers, competitors, channels, and economics change.
Conclusion
Founding a company is a matter of converting value to the customer into a system which is organized for increased productivity.
The initial phase is all about learning, delivering customer value, activation and retention. Avoid the temptation of chasing high numbers that may lack substance for a new business. Once a startup gets some traction, it can establish early repeatable channels of acquisition, conversion and retention, optimize pricing and analyze unit economics.
This makes growth experiments just a way to turn assumptions into evidence. Rather than feeling out your way to experiment ideas, the growth team can pinpoint bottlenecks, create hypotheses, test new models, measure their impact, and keep records of what’s learned.
Finally, the question turned to “Is it possible for us to mature? is it possible for us to mature, accurately and cost-effectively at a bigger scale?
Given this, a startup is in a stronger position for scale when: Providing value is a repeatable process. Acquisition mechanisms are scalable. Unit economics are known. Customers are retained. The organization is capable of handling the demand.
The most rational startup growth formula thus cannot merely be “grow faster”. It should be a system which makes customer value, customer acquisition, customer retention, revenue, experimentation, and operational efficiencies all mutually reinforcing.