

Financial Statements Explained: Balance Sheet, Income Statement, and Cash Flow
Last Updated: September 21, 2026
Financial statements are the basis of business financial analysis. If you are a business owner, investor, accountant, manager, or just a student, finance statements enable you to analyze a company‘s viability, profit expectations, liquidity, and long-term sustainability.
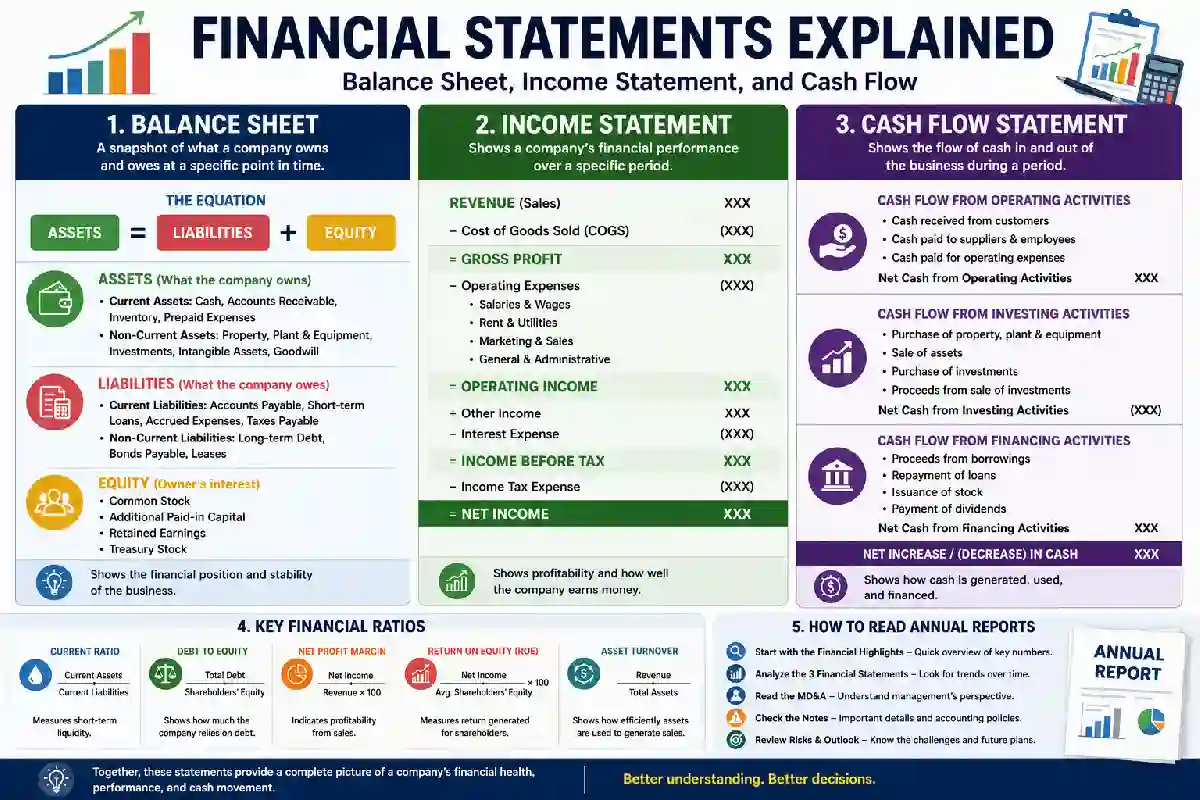
The key financial statements are the balance sheet, income statement and cash flow statement. Each one looks at a different aspect of the finances of an enterprise, but combining them allows an overall picture to be formed of how the enterprise functions and handles its finances.
This guide introduces the inancial statement elements, essential fi ancial ratios and how to read annual reports.
1. Balance Sheet Components
A balance sheet is a snapshot of a business’ financial position at a particular point in time. It details what the business is worth, both in terms of what it possesses and what liabilities exist.
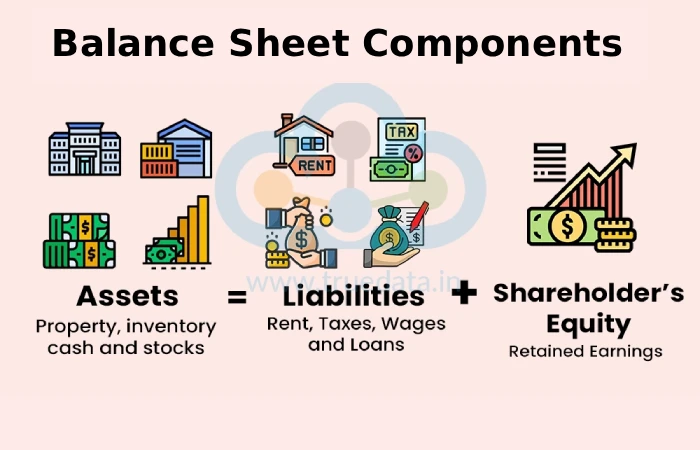
The basic accounting equation is:
Assets = Liabilities + Shareholders’ Equity
Assets
These are resources which the company controls and which have value. They are further classified as being either current assets or non-current assets.
Current assets can typically be converted into cash within one year and include:
- Cash and cash equivalents
- Accounts receivable
- Inventory
- Short-term investments
- Prepaid expenses
Non-current assets are held for longer periods and may include:
- Property, plant, and equipment
- Long-term investments
- Intangible assets
- Goodwill
Liabilities
Liability- Money owned by the company.
Examples of current liabilities include, accounts payable, short term debts, expenses accrued and taxes payable. Long term liabilities include long term loans, bonds, leases and other liabilities.
Shareholders’ Equity
Shareholders’ equity is the owners’ residual interest after total liabilities are deducted from total assets. It consists of common stock, additional paid in capital, retained earnings and treasury stock.
A healthy balance sheet usually indicates that a company has adequate assets with a comfortable debt position, although an ideal scenario will depend hugely on the sector.
2. Income Statement Structure
The income statement (also known as a profit and loss statement, or P&L):This reports on the company‘s financial performance over a period of time.
Unlike the balance sheet where the data refer to a point in time the income statement has a period (e.g. quarter or trading year).
A common format for an income statement begins with revenue, which is income earned from sale of goods or services.
The company then subtracts the cost of goods sold (COGS) to calculate gross profit:
Gross Profit = Revenue − Cost of Goods Sold
Then subtract operating expenses (e.g. labor, rent, marketing, research, admin, etc.) to get operating income.
The statement may also include:
- Interest Received/Payable
- Gains and losses
- Taxes
- Depreciation and amortization
- Other non-operating items.
The last course of action is, the net income/ net profit defined as the profit after all expenses and tax.
Comparing revenue and net income over multiple periods might be valuable. Revenue growth over time along with healthy profit margins could be considered a sign of a successful business while a fast growth of expenses signals potential future problems.
3. Cash Flow Statement Basics
A cash flow statement records the flow of cash owned into and out of a business during a period of time.
This statement is of great importance as a company can declare accounting profits but have actual cash-flow issues.
Cash flows are divided into three major categories:
Operating Activities
Operating cash flow is associated with the company’s main activities. It could be associated with the cash received from customers and cash paid for inventory, wage, suppliers, taxes, and many other operating expenses.
A positive operating cash flow (before working capital changes) is usually an indicator of a business‘s capacity to generate cash through operations.
Investing Activities
The investing activities relate to buying/selling of long term assets and investments.
Examples include:
- Buying Equipment,
- Constructing new buildings
- You acquire another company
- Property sales (selling property)
- Clearing through purchase or sale
Large negative investing cash flows are, in some cases, positive. When a company is expanding, it might be investing in equipment, a new building, or technology.
Financing Activities
Financing cash flow – Cash inflow/outflow resulted from the financing activity (debt & equity).
Examples include:
- Issuing shares
- Borrowing money
- Repaying loans
- Paying dividends
- Repurchasing company‘s own shares.
Examining the three category allows investors to gain better understanding of how a company generates flows of cash.
4. Key Financial Ratios to Analyze
The following ratio will aid you in comparing companies and accessing their financial performance.
Current Ratio
Current Ratio = Current Assets ÷ Current Liabilities
It is used to determine short-term debt-paying ability, such as creditors’ or suppliers, etc. The higher the ratio, the better the company‘s short-term liquidity position, though an excessively high ratio may be due to a poor utilization of assets.
Debt-to-Equity Ratio
Debt-to-Equity = Total Debt ÷ Shareholders’ Equity
This ratio shows to what extent a company relies heavily on debt. A company already using a lot of debt in comparison with equity can be more exposed when time or economic conditions change.
Gross Profit Margin
Gross Profit Margin = Gross Profit ÷ Revenue × 100
Is a measure of net earnings that remains after deducting the costs related to producing goods and services.
Net Profit Margin
Net Profit Margin = Net Income ÷ Revenue × 100
This shows the profit gained from every dollar earned.
Return on Equity
ROE = Net Income ÷ Average Shareholders’ Equity × 100
ROE reflects the ability of a firm to produce profits from money shareholders have invested in it.
Ratios need to be considered in a broader context. They become far more meaningful if compared to the previous year, competitors and the wider industry.
5. How to Read Annual Reports
An annual report enables the company to provide three key types of information: its financial performance, strategy and risks; how the business operates; and the outlook for the future.
To begin, examine the company‘s financial highlights look for changes in revenue, operating income, net income, cash flow, debt, and other important figures.
Then analyze the financial statements for a number of years rather than one. Analyze the balance sheet, income statement and cash flow statement, and the expected growth in sales, profits, costs, assets, liabilities and cash generation.
The management discussion and analysis (MD&A) can be a helpful place to look for reasons behind significant financial changes. The MD&A could explain reasons for raised revenue, changed costs or management‘s perspective on new opportunities or threats.
And examine the company‘s risk factors. Concerns involving competitors, regulation, supply network, interest rates, technology or customers should be considered when analyzing future prospects.
Review the notes to the financial statements. The notes will highlight information on accounting policies, debt, leases, acquisitions, legal issues, and anything else that might not be readily apparent from the main statements.
Conclusion
Knowing about financial statements is one of the skills needed for analyzing the financial health of a company. The balance sheet reveals the resources a company has and debt it owes; the income statement describes a company’s profit; and the cash flow statement interprets flows of cash in and out of a company.
Financial ratios allow investors to further analyze the numbers by assessing liquidity, profitability, leverage and efficiency. the annual reports combine this with management discussion and analysis, disclosures of risk and other financial information.
Rather than depend on one measure, if you learn how to read this document in conjunction with one on a daily basis, then you‘ll be in a better position to make decisions in your business and for investment purposes.