

Innovation KPIs & Metrics: How to Measure R&D Success in 2026
Last Updated: September 21, 2026
Innovation is critical for firms that want to stay competitive. It is simply too costly to just generate ideas, test them in the market, and pursue projects and experiments indefinitely with no way to quantify value to the business.
The most important thing for R&D leaders in 2026 will not be whether their organizations meet the level of research or development, but rather whether their R&D investments on products provide the right kind of worth more learning, IP, revenue, and long-term competitive advantage.
This is why companies need a balanced set of innovation KPIs and metrics.
R&D, patent filings, projects completed still have relevance. Today‘s Innovation teams must also seek measurements of experimentation, adoption by customer, commercialization, lead time, portfolio health, productivity and (financial) returns.
In this guide we show the key innovation KPIs for 2026, covering the innovation ROI, R&D efficiency indicators, time to market KPIs, innovation pipeline indicators and proven approaches to measuring innovation achievement.
What represent Innovation KPIs?
Innovation KPIs are quantifiable metrics that can be used to measure if an organization is getting substantial results from innovation and R&D initiatives.
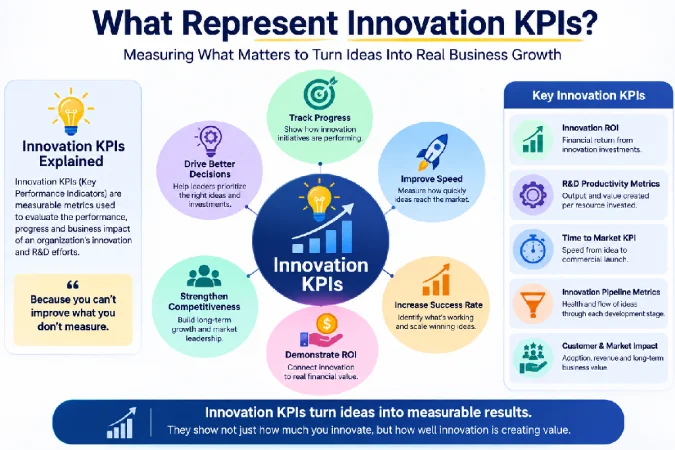
They help leadership answer questions such as:
- Are we investing in the right projects?
- How efficiently is R&D converting resources into outcomes?
- How quickly are ideas becoming market-ready products?
- Are customers adopting our innovations?
- Which experiments should receive more investment?
- How much revenue comes from new products?
- Are we learning quickly from unsuccessful experiments?
- Is our innovation pipeline healthy?
- Are R&D investments generating an acceptable return?
The important point is that no single KPI can measure innovation success.
A company could launch 20 products and still have weak innovation performance if customers don’t adopt them. Another company might cancel several experiments but generate significant learning that leads to one highly successful product.
In all, therefore, an integrated mix of process, output, outcome and financial measures would be required.
Why Innovation Measurement Matters in 2026
The economics of innovation are undergoing a transformation. Innovation supported by AI including product development, automation, cloud infrastructure, advanced analytics, digital prototyping and collaborative development tools may diminish some R&D cycles but also amplifies the number of experiments the teams can perform.
That creates a measurement challenge.
If teams can generate more ideas and prototypes than ever before, simply counting projects becomes less useful.
Organizations increasingly need to understand:
- Which experiments create evidence?
- Which products create customer value?
- Which investments create commercial value?
- Which capabilities create long-term strategic advantage?
The best innovation measurement systems therefore move beyond activity tracking toward evidence-based portfolio management.
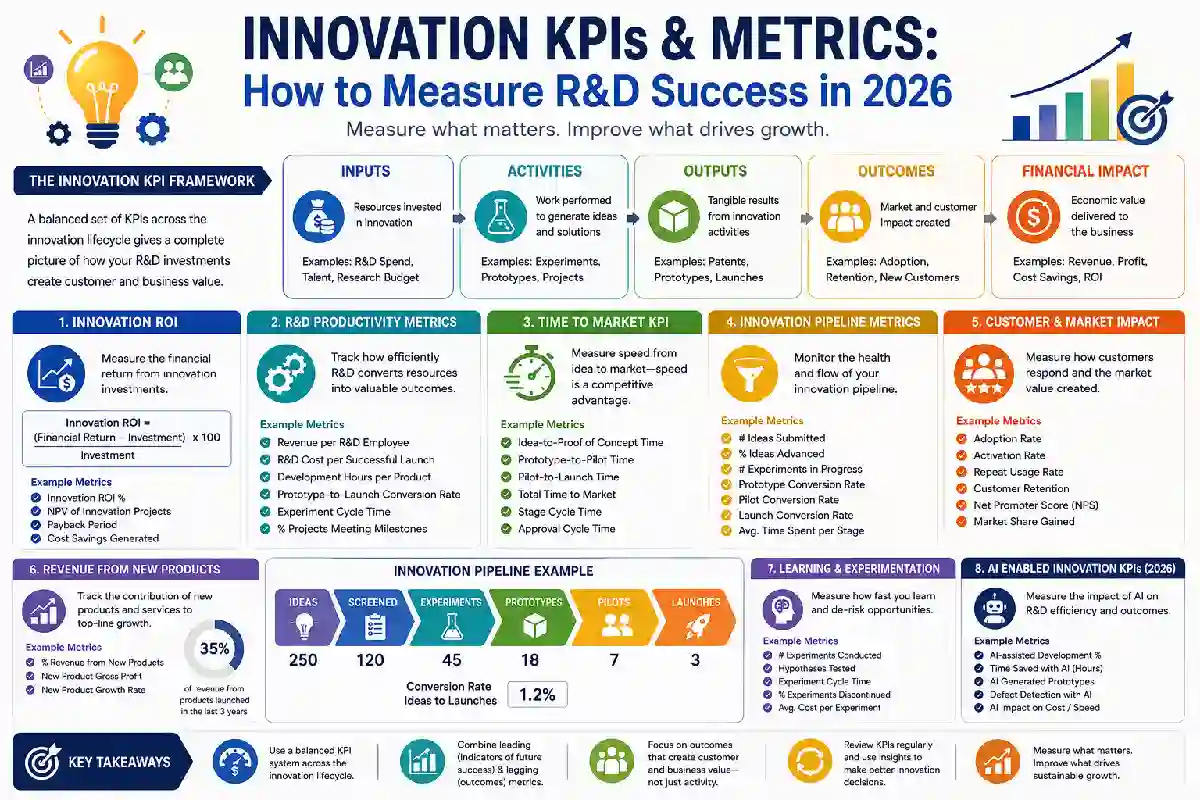
The Innovation KPI Framework
A useful framework divides innovation metrics into five categories:
| KPI Category | What It Measures | Example Metrics |
| Inputs | Resources invested | R&D spending, talent, research budget |
| Activities | Work performed | Experiments, prototypes, research projects |
| Outputs | Tangible results | Patents, prototypes, launches |
| Outcomes | Market and customer impact | Adoption, retention, revenue |
| Financial impact | Economic value | Innovation ROI, profit, cost savings |
This structure prevents leaders from focusing only on easily counted activities.
For example:
100 prototypes created is an output.
20 prototypes reaching customers is a stronger commercialization indicator.
5 products generating significant recurring revenue is an outcome.
What Should Be Included in Innovation ROI?
Depending on the business, returns can include:
- New product revenue
- Incremental revenue
- Gross profit
- Cost savings
- Productivity gains
- Reduced development costs
- Licensing income
- Intellectual property value
- Customer retention improvements
- New market access
Leaders should clearly define what counts as an innovation-related return before calculating ROI.
R&D Productivity Metrics
R&D productivity metrics measure how effectively research and development resources are converted into useful outcomes.
Common metrics include:
- Revenue generated per R&D employee
- R&D cost per successful launch
- Development hours per product
- Engineering cycle time
- Prototype-to-launch conversion rate
- Research-to-commercialization conversion rate
- Percentage of projects meeting development milestones
- Rework rate
- Defect rate
- Experiment completion rate
- Percentage of development work automated
Common Time to Market Measurements
Organizations can track:
- Idea-to-prototype time
- Prototype-to-pilot time
- Pilot-to-launch time
- Total development cycle time
- Average time between development stages
- Approval cycle time
- Time spent waiting between teams
- Time required to resolve critical defects
A useful approach is to break total time to market into smaller stages.
For example:
Idea → Validation → Prototype → Testing → Pilot → Launch
If the overall process takes 12 months, leadership needs to know where those 12 months are being spent.
Perhaps actual development requires six months while approvals and handoffs consume another six.
Without stage-level measurement, that bottleneck can remain invisible.
How to Improve Time to Market
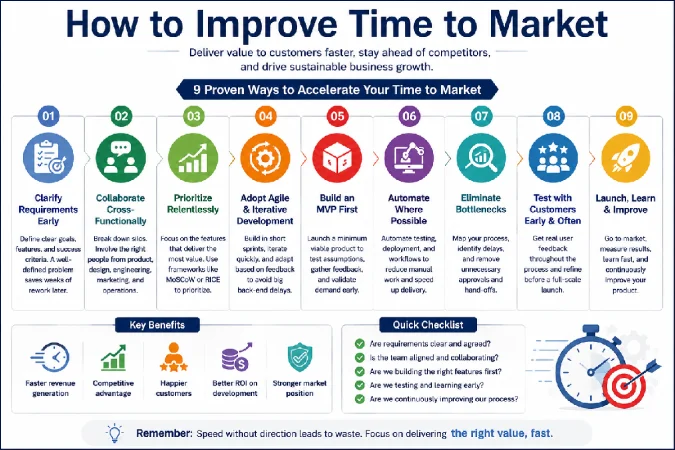
Companies can often improve time to market by:
- Reducing unnecessary approval layers
- Creating cross-functional development teams
- Automating repetitive testing
- Using rapid prototyping
- Testing with customers earlier
- Standardizing development processes
- Using AI-assisted development where appropriate
- Reducing unnecessary handoffs
- Establishing clear product ownership
The goal shouldn’t be to launch quickly at any cost.
The goal is to reduce avoidable delays while maintaining product quality and customer value.
Why Pipeline Balance Matters
A healthy innovation portfolio shouldn’t contain only mature projects.
If every project is close to launch, the company may have strong short-term opportunities but weak future growth.
Likewise, if most projects are still speculative ideas, the company may have plenty of creativity but poor commercialization discipline.
A balanced portfolio could contain:
Core innovations – Lower risk, closer to commercialization
Adjacent innovations – New customers, markets, or business models
Transformational innovations – Higher-risk opportunities with potentially significant long-term impact
The exact percentages should depend on the organization’s strategy and risk tolerance.
Measuring Innovation Success Beyond Revenue
Revenue is important, but it isn’t always the right early-stage innovation metric.
An experimental project may not generate revenue for several years.
Instead, early-stage teams can measure evidence of progress.
Early-Stage Metrics
Useful indicators include:
- Customer interviews completed
- Customer problems validated
- Experiments conducted
- Hypotheses tested
- Prototype usage
- Pilot participation
- Customer feedback
- Product engagement
- Repeat usage
- Willingness to pay
- Technical feasibility
- Cost-to-serve estimates
Customer Adoption as an Innovation KPI
An innovation doesn’t create meaningful value simply because it launches.
Customers must actually use it.
Important adoption metrics include:
- Number of new customers
- Adoption rate
- Activation rate
- Repeat usage
- Customer retention
- Feature usage
- Customer satisfaction
- Net promoter indicators
- Conversion rate
- Churn rate
For digital products, organizations can also monitor:
Activation → Engagement → Retention → Expansion
A product with high initial adoption but poor retention may indicate that the innovation creates initial curiosity but doesn’t provide lasting value.
Revenue from New Products
One of the strongest innovation metrics for established companies is the percentage of revenue generated by products or services launched within a defined period.
For example:
New Product Revenue % = Revenue from qualifying new products ÷ Total revenue × 100
Companies should define “new” carefully.
A minor feature update shouldn’t necessarily qualify as a new innovation.
The metric becomes more useful when organizations establish clear criteria for what constitutes a genuinely new product, market, or business model.
Why This Metric Matters
Revenue from new products can reveal whether R&D is translating into commercial outcomes.
However, it should not be used alone.
A company operating in a long-cycle industry may have excellent innovation capabilities even when new products take years to generate substantial revenue.
Innovation Failure Rate
Failure isn’t automatically a negative innovation outcome.
In experimentation-driven environments, some projects must fail.
The more important question is:
How much did we learn from the failed experiment, and how quickly did we stop investing?
Useful metrics include:
- Percentage of experiments discontinued
- Average cost of failed experiments
- Time to identify unsuccessful projects
- Percentage of failed projects producing reusable learning
- Investment avoided through early validation
It‘s not always a good thing to be quick to weed out the weak ideas. A co. That keeps its weak initiatives alive might simply have a healthier innovation portfolio than one that puts everything through.
Innovation Portfolio Metrics
Innovation however is ultimately a portfolio-management challenge.
Rather than assess programs individually, executives can have a complete picture of portfolio balance.
- Risk
- Investment
- Time horizon
- Market opportunity
- Strategic importance
- Expected return
- Technical uncertainty
AI Innovation ROI
Companies should also evaluate whether AI investments generate measurable business value.
A basic AI innovation ROI model can consider:
AI ROI = (Incremental Financial Benefits − AI Investment) ÷ AI Investment
Benefits may include:
- Reduced development costs
- Faster product launches
- Higher employee productivity
- Increased revenue
- Reduced operational expenses
- Improved customer retention
- New AI-enabled products
- New revenue streams
But companies should also measure risks and hidden costs.
These can include:
- AI infrastructure expenses
- Model costs
- Data preparation
- Security controls
- Governance
- Human oversight
- Training
- Integration costs
- Error correction
This creates a more realistic picture of AI’s economic impact.
Leading vs. Lagging Innovation Metrics
One of the most important distinctions is between leading and lagging indicators.
Leading Indicators
Leading indicators measure activities that may predict future innovation performance.
Examples:
- Number of experiments
- Customer interviews
- Prototype development
- Validated hypotheses
- Pipeline size
- Experiment cycle time
Lagging Indicators
Lagging indicators measure results that have already occurred.
Examples:
- Revenue
- Profit
- Market share
- Customer retention
- Cost savings
- Innovation ROI
A strong dashboard combines both.
If leaders only monitor lagging indicators, they may discover problems too late.
If they only monitor leading indicators, they may confuse activity with actual business impact.
How to Build an Innovation Measurement System
Companies can build an effective measurement system using seven steps.
1. Define What Innovation Means
Decide whether innovation includes:
- New products
- New services
- New markets
- New business models
- Process improvements
- Technology development
Without a definition, KPI data becomes inconsistent.
2. Connect KPIs to Strategy
Every major innovation KPI should support a strategic objective.
If the company is trying to enter new markets, customer acquisition and new-market revenue may matter more than patent counts.
3. Create Stage-Specific Metrics
Don’t evaluate an early research project using the same metrics as a commercial product.
Early-stage projects need learning and validation metrics.
Late-stage projects need adoption and financial metrics.
4. Establish Clear Definitions
Define exactly what counts as:
- A new product
- A successful experiment
- A qualified innovation
- A launch
- Innovation revenue
- An R&D project
This prevents teams from manipulating metrics or interpreting them differently.
- Build a Single Dashboard
Executives should be able to see:
Investment → Activity → Pipeline → Customer → Financial Impact
in one place.
The Future of Innovation Measurement in 2026
The measurement of innovation is moving towards more dynamic and quantifiable systems.
AI can also assist in tracking project progress, take the analysis of customer comments, identify bottlenecks during development and make predictions about real portfolio performance.
While, at the same time, Dashboards should be avoided, as they are likely to build dashboards with dozens of metrics that no-one will use.
Conclusion
In 2026 we will need more than counting patents, projects, prototypes or R&D spend to measure success of innovation in the future.
The best organizations tie the three axes back to each other: investment to activity, activity to learning, learning to customer value, and customer value to financial and strategic results.
Innovation Return on Investment (ROI) indicates the extent to which investments are adding economic value. R&D productivity measures reflect how effective teams are at transforming resources into results. Time to market KPI‘s highlight inefficiencies in the development process. Innovation pipeline metrics aim to determine if sufficient opportunities are headed to market.
Similarly, measures of customer adoption, experimentation and learning enable leaders to assess whether initiatives are on track prior to the realization of significant revenue.